Create custom static or data-driven dynamic tooltips for illustrate assets (shapes, images, and graphics), using dynamic text functions. When added to presentations, the asset displays the tooltip that you've configured "on hover." Dynamic tooltips are driven by the underlying dynamic text function, based on the data discovery that was used to create the dynamic text.
The tooltip designer offers the ability to enhance the presentation by supplementing it with context-driven information.
Custom Tooltips
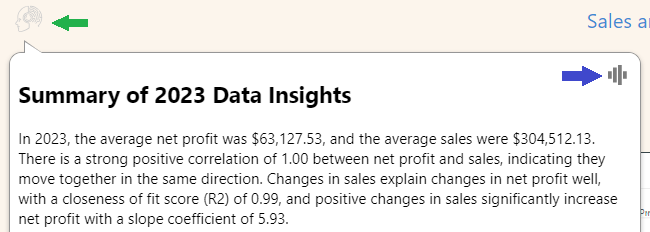
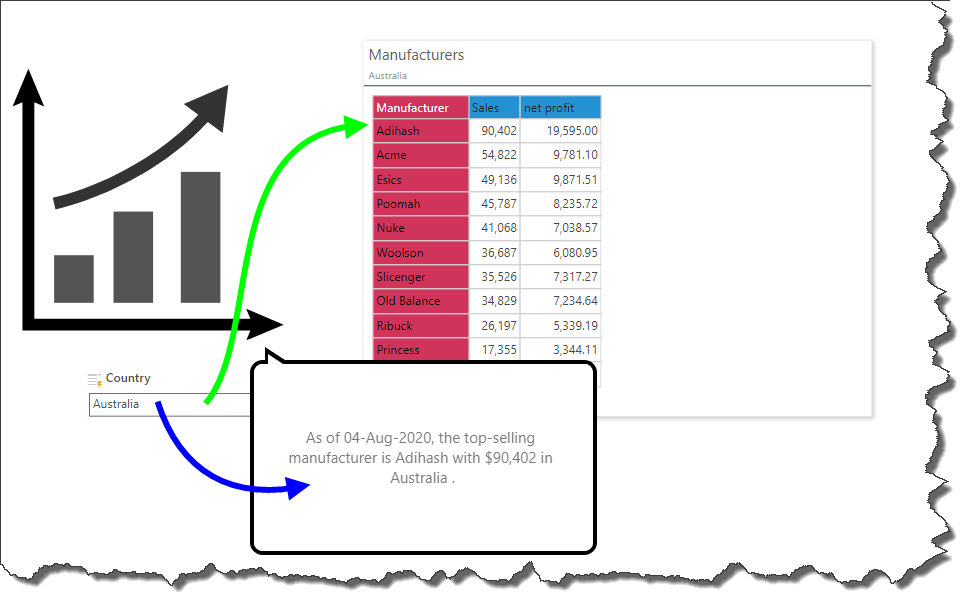
Tooltips are shown in presentations at runtime, when the reader hovers their cursor over the asset (green arrow) that the tooltip is associated with. The user can click the Audio icon (blue arrow) in the pop-up bubble to hear the information in the pop-up read aloud.
Opening the Tooltip Designer
The tooltip designer can be accessed from both Illustrate and Present.
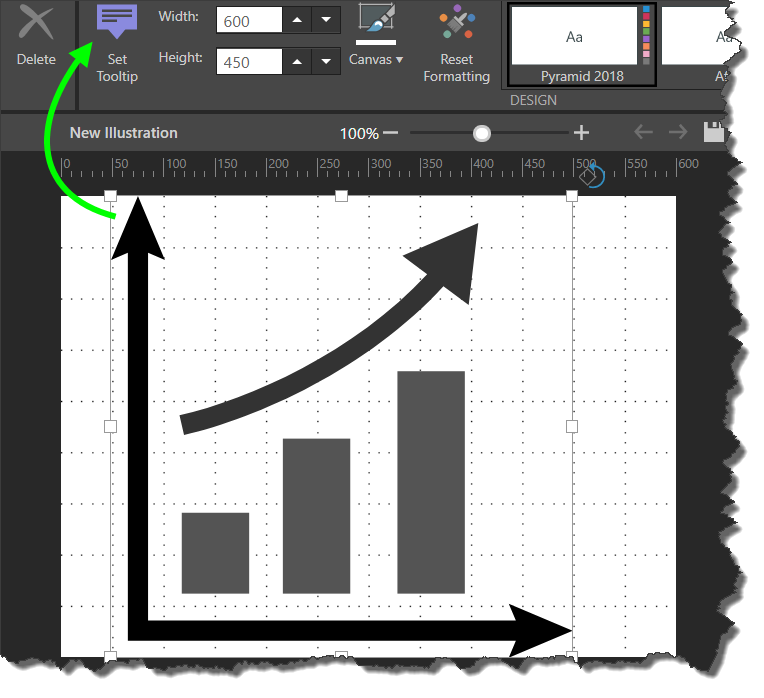
From Illustrate, you can open the tooltip designer by clicking Set Tooltip (green highlight below) from the Illustration ribbon. Be sure to have the relevant asset selected when you open the designer.

The Tooltip Designer
Use the tooltip designer to create and configure the content for your tooltip.
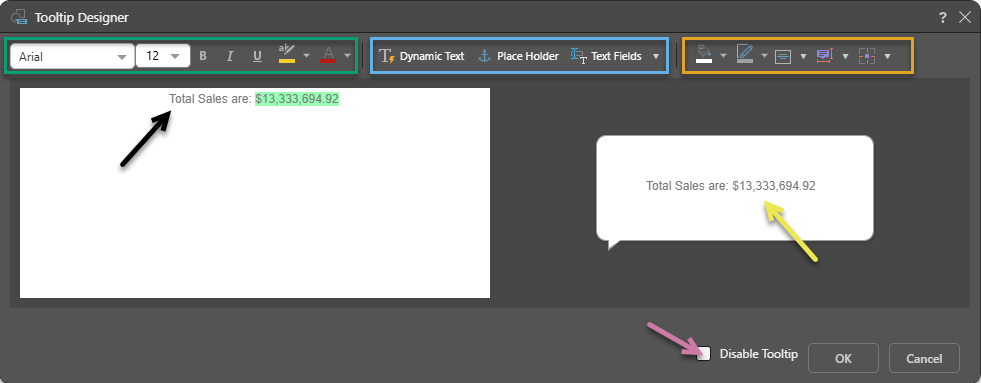
The basic functionality here is that you type the content that you want in your tooltip into the left-hand panel (black arrow), and that content is previewed in the right-hand tooltip bubble (yellow arrow). The options along the top of the panel allow you to format and customize that tooltip content, and to add dynamic text to it, as needed.
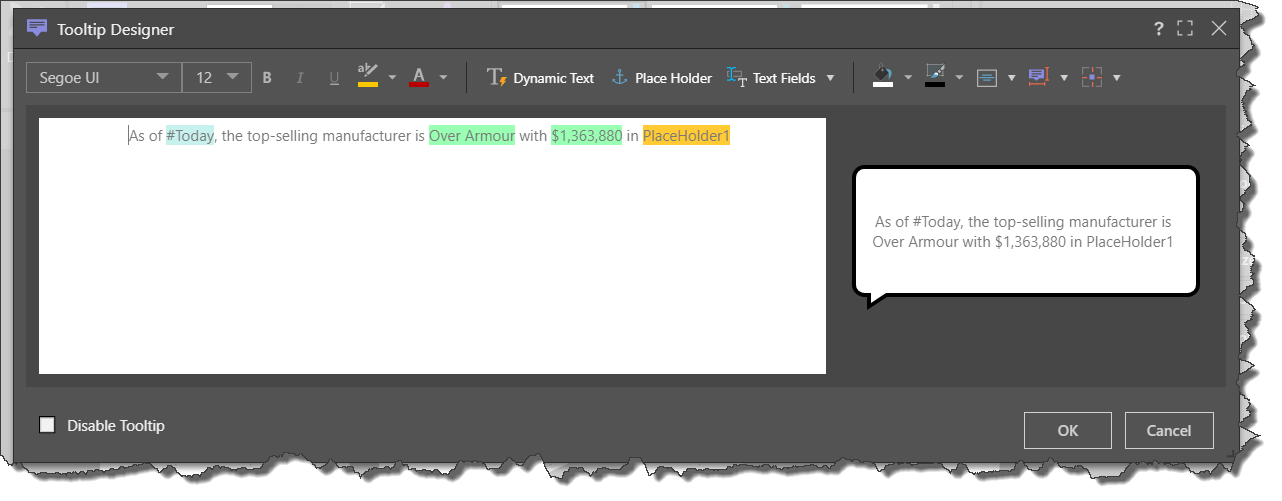
Note: In addition to the options below, you can also use the Disable Tooltip option (purple arrow) to temporarily suspend use of the tooltip without having to delete it. This stops the tooltip from being shown in the output temporarily without losing its details.
Tooltip Formatting
- Use the Font Formatting options (green highlight above) to set the font type, size, emphasis, color, and highlights for your tooltip. For more information about font / text formatting, see Text Formatting.
- Use the Tooltip Formatting options (orange highlight) to set the tooltip background color and border color, text alignment, tooltip size (including AUTO, which you should use if the final size of your dynamically created content is unknown), and padding.
Dynamic Content
You can use the Dynamic options (blue highlight above) to make your tooltip dynamic. These options allow you to add dynamic text, dynamic placeholders, and variable text fields to your tooltip.
Dynamic Text
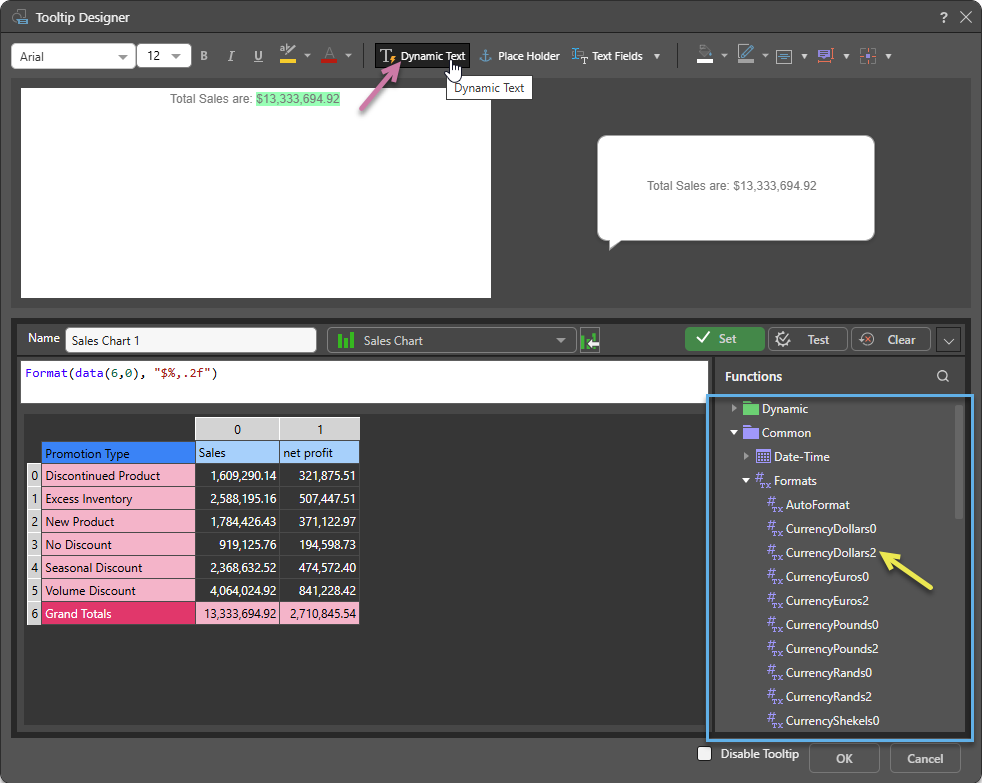
Selecting the Dynamic Text button (purple arrow below) opens the dynamic text editor at the bottom of the dialog, where you can create your dynamic text formula.
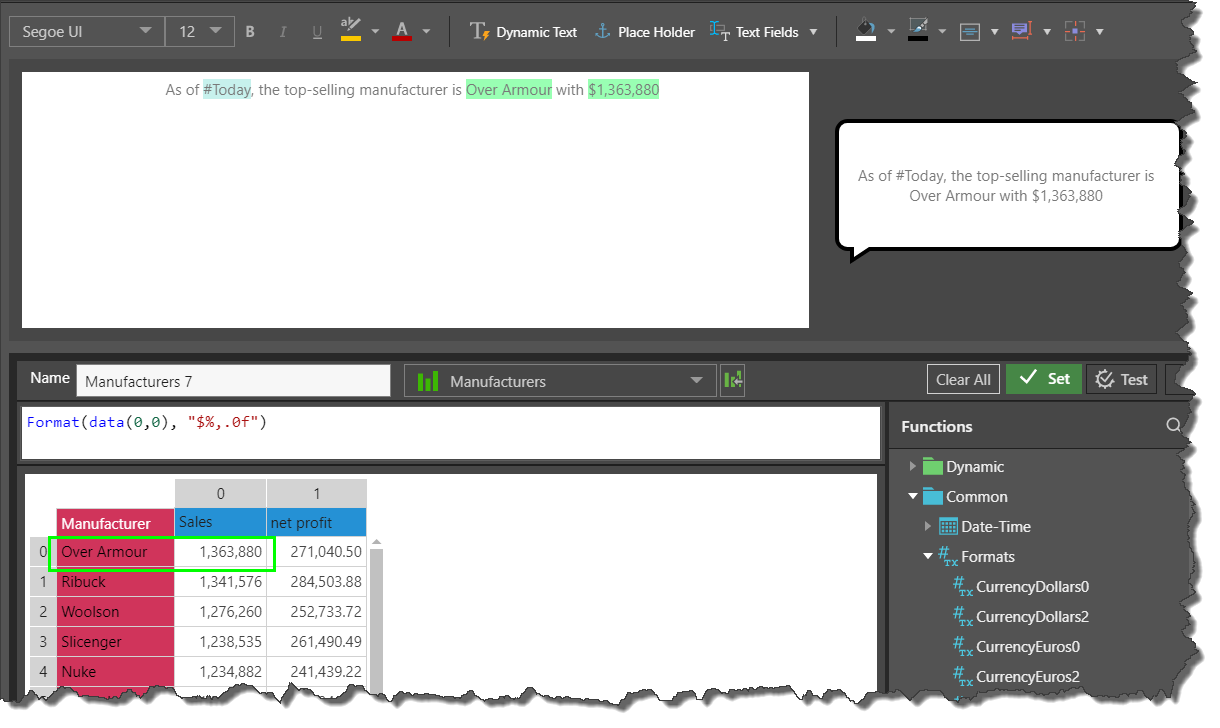
Dynamic text formulas are created by selecting a data grid and then using the PQL functions (blue highlight) combined with the relevant grid elements (the data from cells, columns, or rows) to pull and transform the data that should be included in the tooltip at runtime.
Here, a single dynamic text function is created that shows the total sales based on data in the selected grid (Sales Chart, cell 6,0) and formatted as a dollar value with two decimal places (CurrencyDollars2):
Place Holder
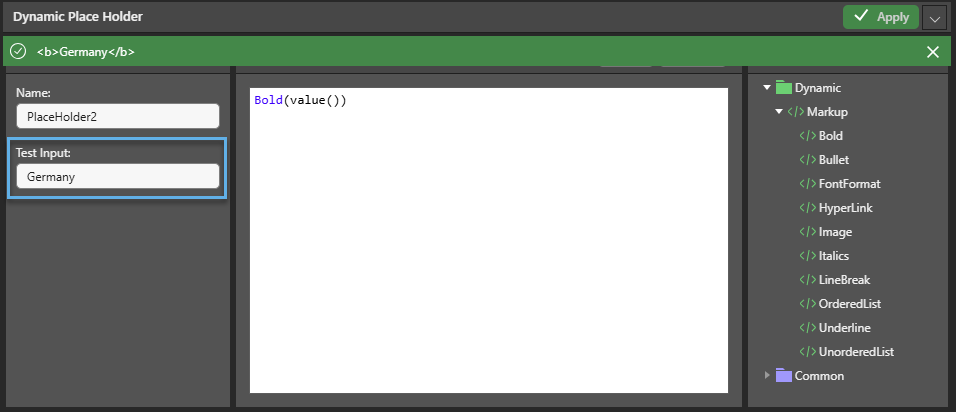
Selecting the Place Holder button (purple arrow below) opens the Dynamic Place Holder editor, where you can create a formula using the function trees. Unlike dynamic text, placeholders are slicer-driven; instead of creating a formula based on an underlying grid, you will need to add your placeholder and then create an interaction from a slicer to the placeholder in your tooltip to replace value() with the selected value from the slicer at runtime.
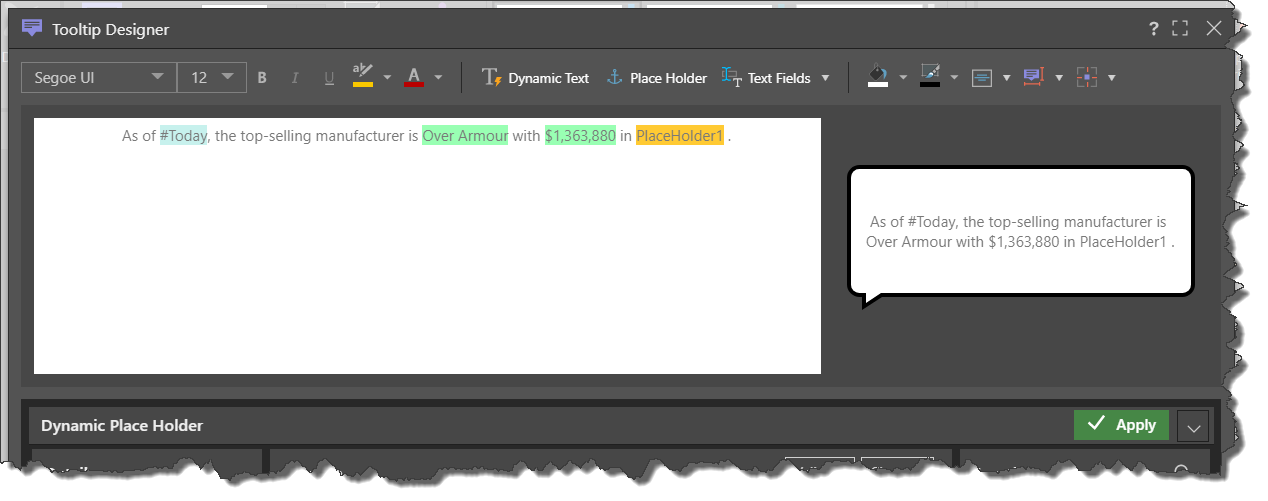
Here, two placeholders are added, along with dynamic text. The two placeholder values are rendered at runtime based on the slicer selections.
If interactions are added to the discovery that was used to build the dynamic text, then the value will also reflect the slicer selections.
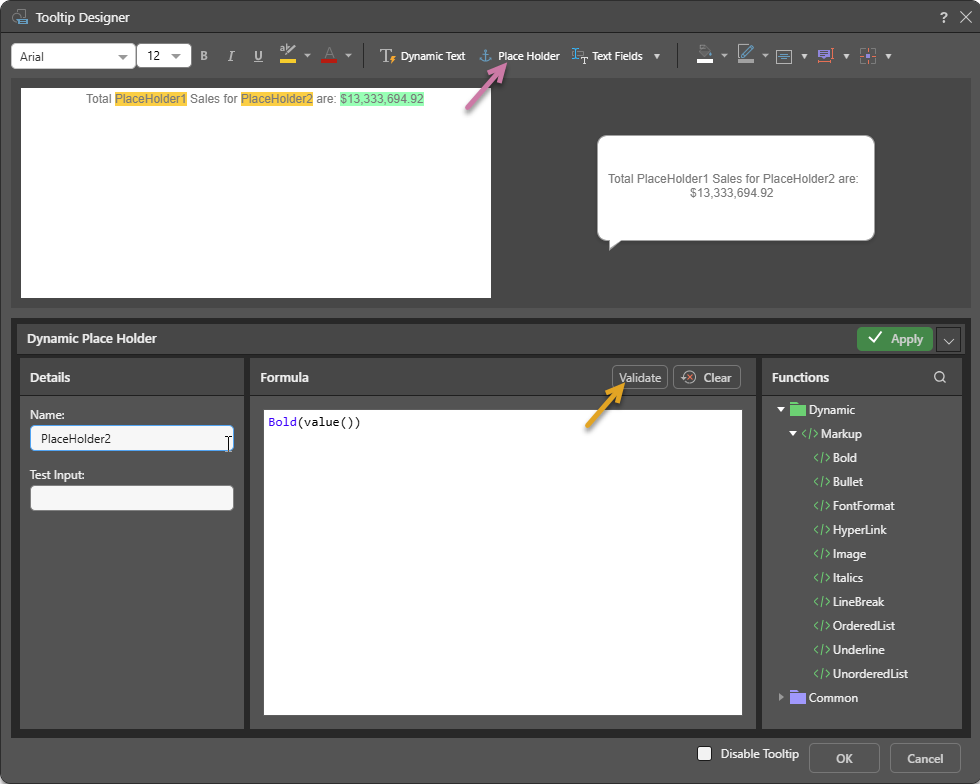
You can test the placeholder by typing a string into the Test Input field (blue highlight below) and clicking Validate (orange arrow above). If successful, you'll see the given text (including any markup you've applied) in a green bar. If unsuccessful, an error message will appear in a red bar.
- Click here to learn more about dynamic placeholders
Variable Text Fields
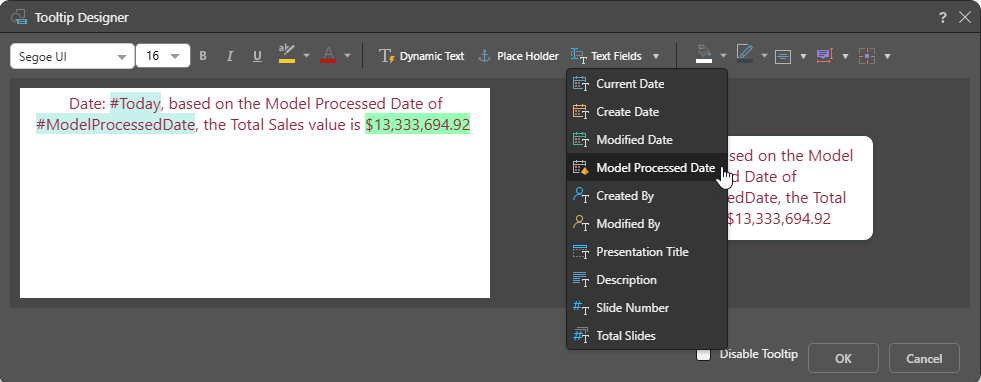
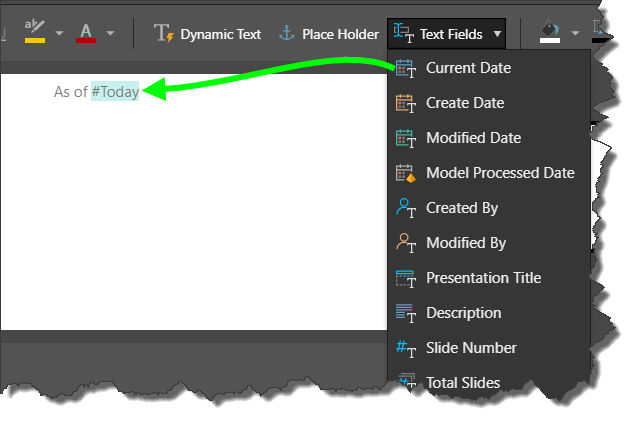
Add variable text fields from the dropdown menu. Selecting a text field adds the relevant variable tag to the tooltip, which is then rendered at runtime to reflect the dynamic value. For example, selecting the Current Date text field will add the tag #Today to the tooltip and, when the presentation is launched at runtime, the tag will be replaced with today's date.
Here, two variable text fields are added, so that the tooltip includes the current date and the model processed date when opened at runtime:
- Click here to learn more about dynamic text fields.
Creating a Dynamic Tooltip
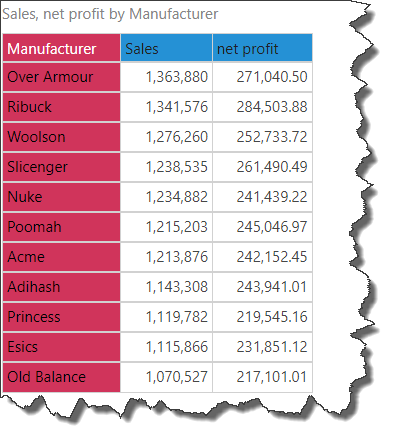
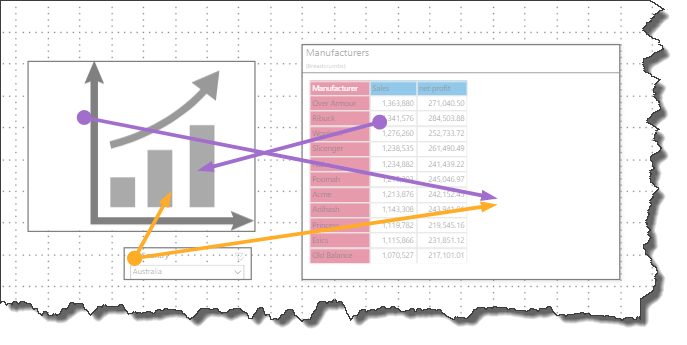
The following example shows the creation of a dynamic tooltip that features dynamic text, a dynamic place holder, and a text field. The example is based on the following grid, showing Sales and Net Profit by Manufacturer, and sorted in descending order.
This tooltip will feature the text 'As of #Today, the top-selling manufacturer is x with x in PlaceHolder1.'
- #Today: this text field will show the current date.
- x: the first 'x' will be configured as dynamic text, showing the top-selling manufacturer.
- x: the second 'x' will be configured as dynamic text, showing the sales for the top-selling manufacturer.
- PlaceHolder1: the place holder will be used to inject the country at runtime via a slicer selection.
Step 1
Add the required asset to the canvas, and with the asset selected, click Set Tooltip from the Illustration ribbon.
Step 2
Enter the text that should appear in the tooltip, and format as desired.
To begin, type "As of" and then select Current Date from the Text Fields dropdown menu.
Step 3
Next, continue writing ', the top-selling manufacturer is x with x.'Replace each 'x' with dynamic text; base the dynamic text on the Manufacturers grid pictured above, ensuring the grid has been sorted in descending order. To insert the top manufacturer, click the cell corresponding to the 'Manufacturer' column and the '0' row. To insert the value, click the cell corresponding to the 'Sales' column and the '0' row.
Click 'Set'.
Step 4
Continue writing 'in' and then click the Place Holder Button. Click 'Apply'.
Step 5
Click OK to close the Tooltip Designer, then save your asset.
Step 6
Go to Present and add both the asset and the grid to the same slide. Add a new country slicer as well.
Ensure that interactions are added from the slicer to the graphic asset and the grid.
Step 7
Launch the presentation in runtime; both the grid and the dynamic tooltip will be rendered dynamically according to the slicer selection:
Related information
When adding Dynamic Text or Placeholders to your tooltip, the PQL functions library is shown in the Dynamic Function Editor. To add a PQL function from the library to the script editor, simply double-click it. You will then need to inject values into the function.
Using the AI-Driven LLM PQL Function
Pyramid's Generative AI integration enables you to use AI to generate scripts and images, dynamic text and infographics, calculations and lists, schedules, colors, and more. It allows you to generate a range of content, including complex code, simply by providing a text prompt.
Tip: You can use the LLM PQL function (from the Common PQL functions) to generate dynamic text, adding the results to custom tooltips, text fields, or into your PQL formulas. While this function cannot tell you about your data set, it can add additional information and background to your presentation or publication.
Warning: When using LLMs, your assets are generated using public domain algorithms. This can produce erroneous and inconsistent or random results. Use at your own risk.